Makie Theme
SatelliteAnalysis.jl provides a Makie theme with coordinated dark and light variants, designed for presentation slides and reports. The theme is implemented as a package extension. Hence, it becomes available when a Makie backend is loaded together with SatelliteAnalysis.jl:
using CairoMakie   # Or GLMakie, WGLMakie, etc.
using SatelliteAnalysis
Two functions compose the API (see the Library page for the complete documentation). They are not exported and must be accessed through the package name:
SatelliteAnalysis.makie_theme: return the theme, ready forset_theme!orwith_theme.SatelliteAnalysis.makie_palette: return the firstncolors of the categorical palette.
Quick Start
Apply the theme globally with set_theme! or locally with with_theme:
set_theme!(SatelliteAnalysis.makie_theme())        # Light variant (default).
set_theme!(SatelliteAnalysis.makie_theme(:dark))   # Dark variant.

with_theme(SatelliteAnalysis.makie_theme(:dark)) do
    scatter(rand(100))
end
The recommended figure size for 16:9 slides is Figure(size = (1280, 720)), and the recommended export resolution is save("plot.png", fig; px_per_unit = 2).
The following examples use deterministic sample data:
using CairoMakie
using Random
using SatelliteAnalysis


function line_data(; n = 60, nseries = 3, seed = 1)
    rng = MersenneTwister(seed)
    x = range(0, 4π; length = n)
    ys = [sin.(x .+ 0.7i) .+ 0.12i .+ 0.08 .* randn(rng, n) for i in 1:nseries]
    return x, ys
end

function scatter_data(; n = 90, seed = 7)
    rng = MersenneTwister(seed)
    x = randn(rng, n)
    y = 0.8 .* x .+ 0.5 .* randn(rng, n)
    return x, y
end

bar_data() = (1:5, [3.2, 5.1, 2.4, 4.7, 3.9])

function heatmap_data(; n = 120)
    x = range(-3, 3; length = n)
    y = range(-3, 3; length = n)
    z = [exp(-(xi^2 + yi^2) / 2) * cos(2xi) for xi in x, yi in y]
    return x, y, z
end

# Multi-panel overview showcasing lines, scatter, bars, and an uncertainty band. `dark`
# selects the matching categorical palette for the elements whose color is set explicitly.
function overview_figure(; dark::Bool)
    x, ys  = line_data()
    sx, sy = scatter_data()
    bx, by = bar_data()
    pal    = SatelliteAnalysis.makie_palette(6; variant = dark ? :dark : :light)

    fig = Figure(size = (1280, 760))

    Label(
        fig[0, :],
        "SatelliteAnalysis.jl Makie theme — $(dark ? "dark" : "light") variant";
        fontsize = 26,
        font     = :bold,
        halign   = :left,
        padding  = (8, 0, 0, 0),
    )

    ax1 = Axis(fig[1, 1]; title = "Time series", xlabel = "t [s]", ylabel = "Amplitude")
    for (i, y) in enumerate(ys)
        lines!(ax1, x, y; label = "series $i")
    end
    axislegend(ax1; position = :rt)

    ax2 = Axis(fig[1, 2]; title = "Correlation", xlabel = "x", ylabel = "y")
    scatter!(ax2, sx, sy)

    ax3 = Axis(fig[2, 1]; title = "Categories", xlabel = "group", ylabel = "value")
    barplot!(ax3, bx, by; color = pal[1:length(bx)])

    ax4 = Axis(fig[2, 2]; title = "Uncertainty band", xlabel = "t [s]", ylabel = "Amplitude")
    band!(ax4, x, ys[1] .- 0.3, ys[1] .+ 0.3; color = (pal[1], 0.25))
    lines!(ax4, x, ys[1]; color = pal[1])

    return fig
end
Light Variant
with_theme(SatelliteAnalysis.makie_theme()) do
    overview_figure(dark = false)
end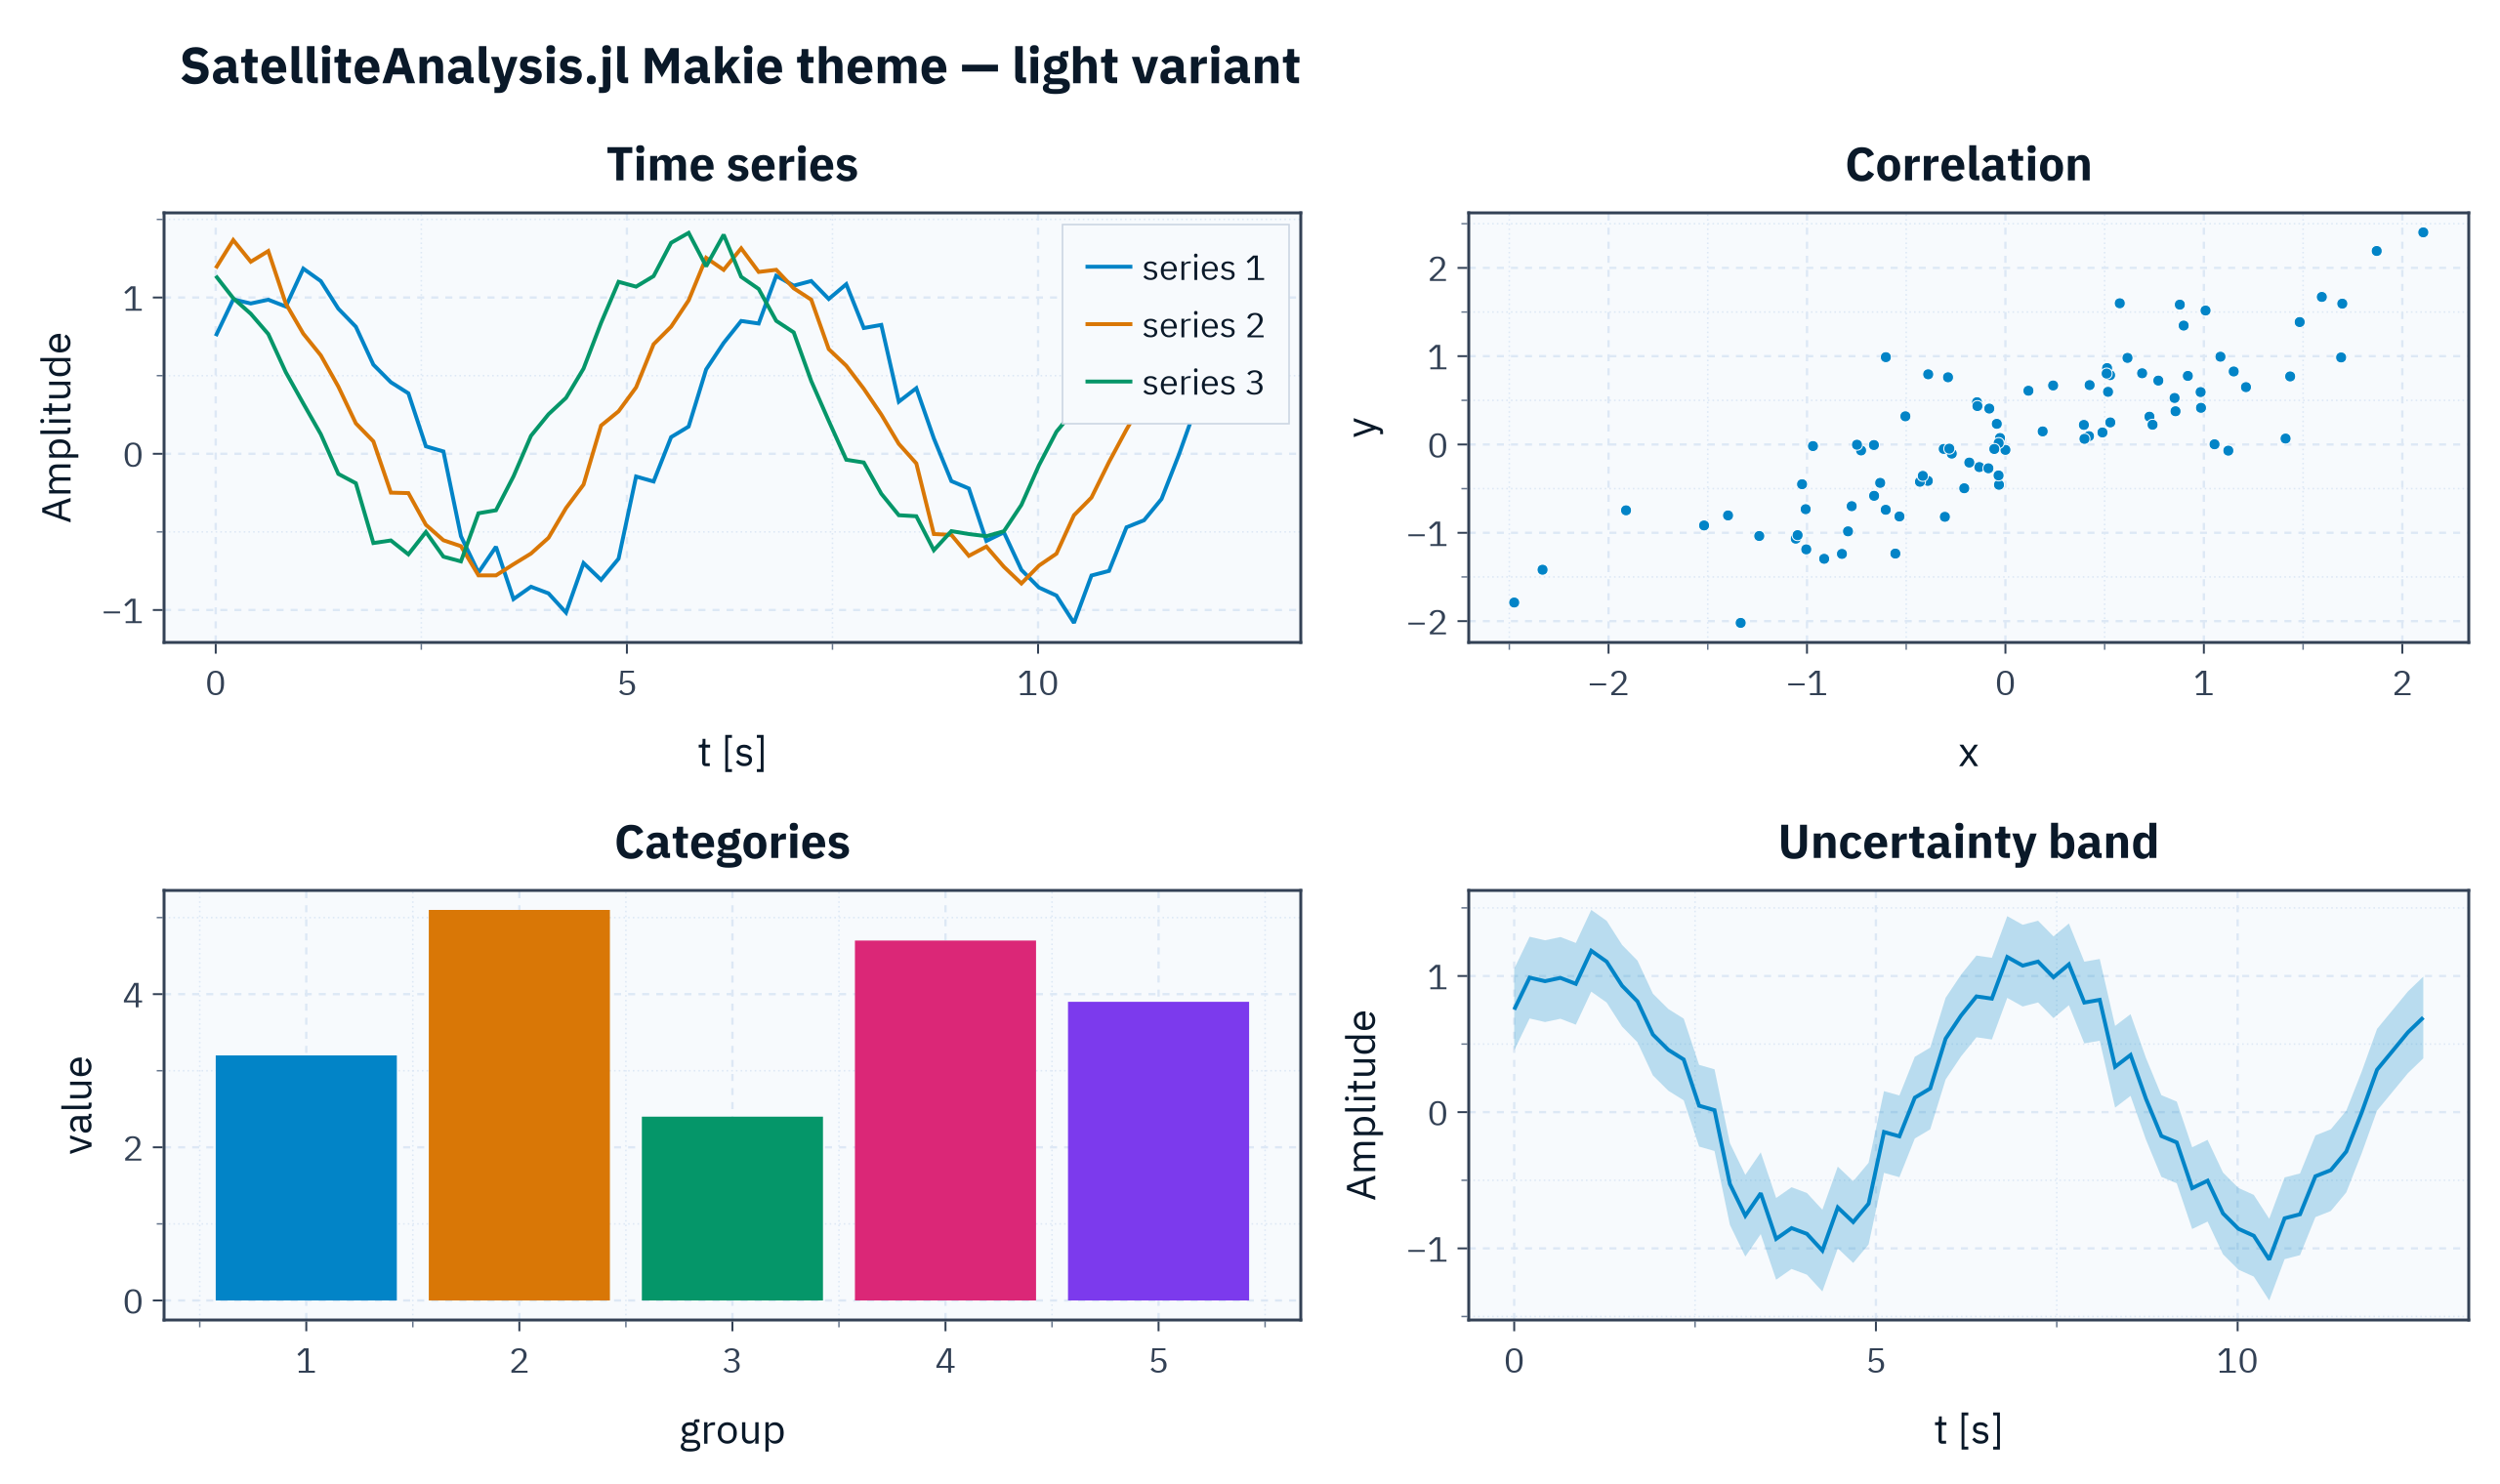
Dark Variant
with_theme(SatelliteAnalysis.makie_theme(:dark)) do
    overview_figure(dark = true)
end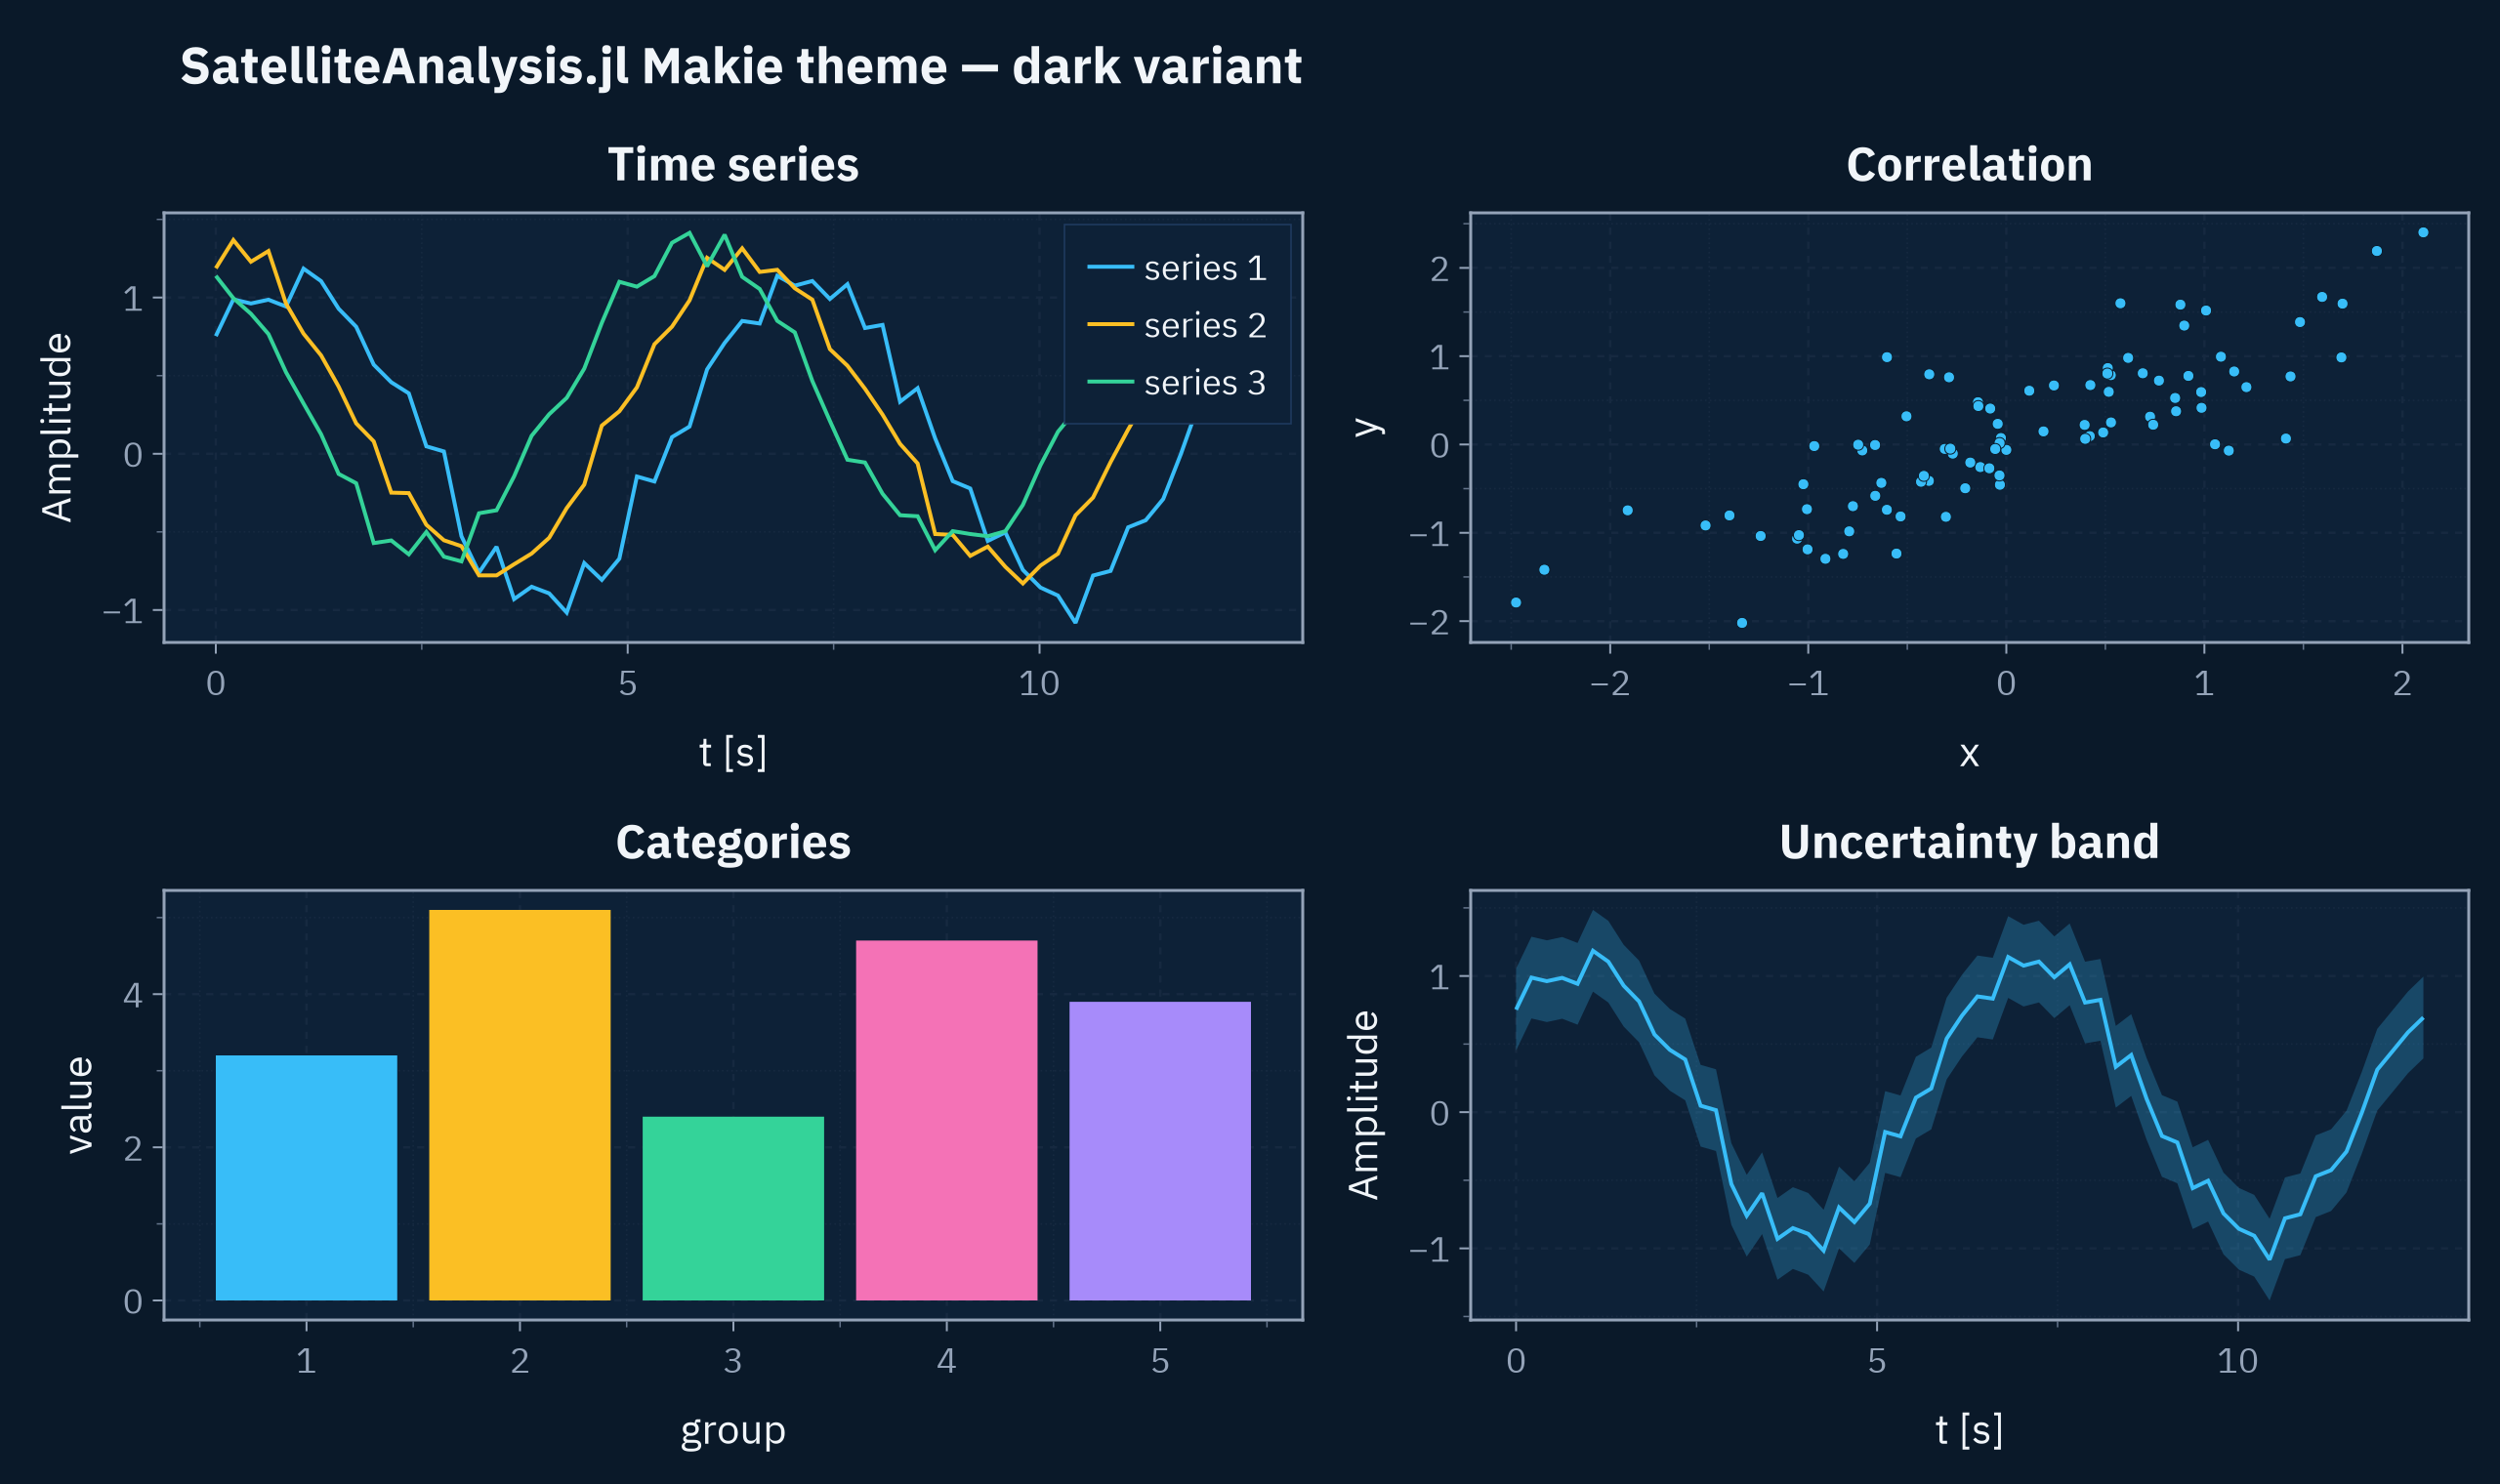
Heatmap and Colorbar
with_theme(SatelliteAnalysis.makie_theme(:dark)) do
    x, y, z = heatmap_data()

    fig = Figure(size = (760, 600))
    ax  = Axis(fig[1, 1]; title = "Heatmap", xlabel = "x", ylabel = "y", aspect = 1)
    hm  = heatmap!(ax, x, y, z)
    Colorbar(fig[1, 2], hm; label = "Intensity")

    fig
end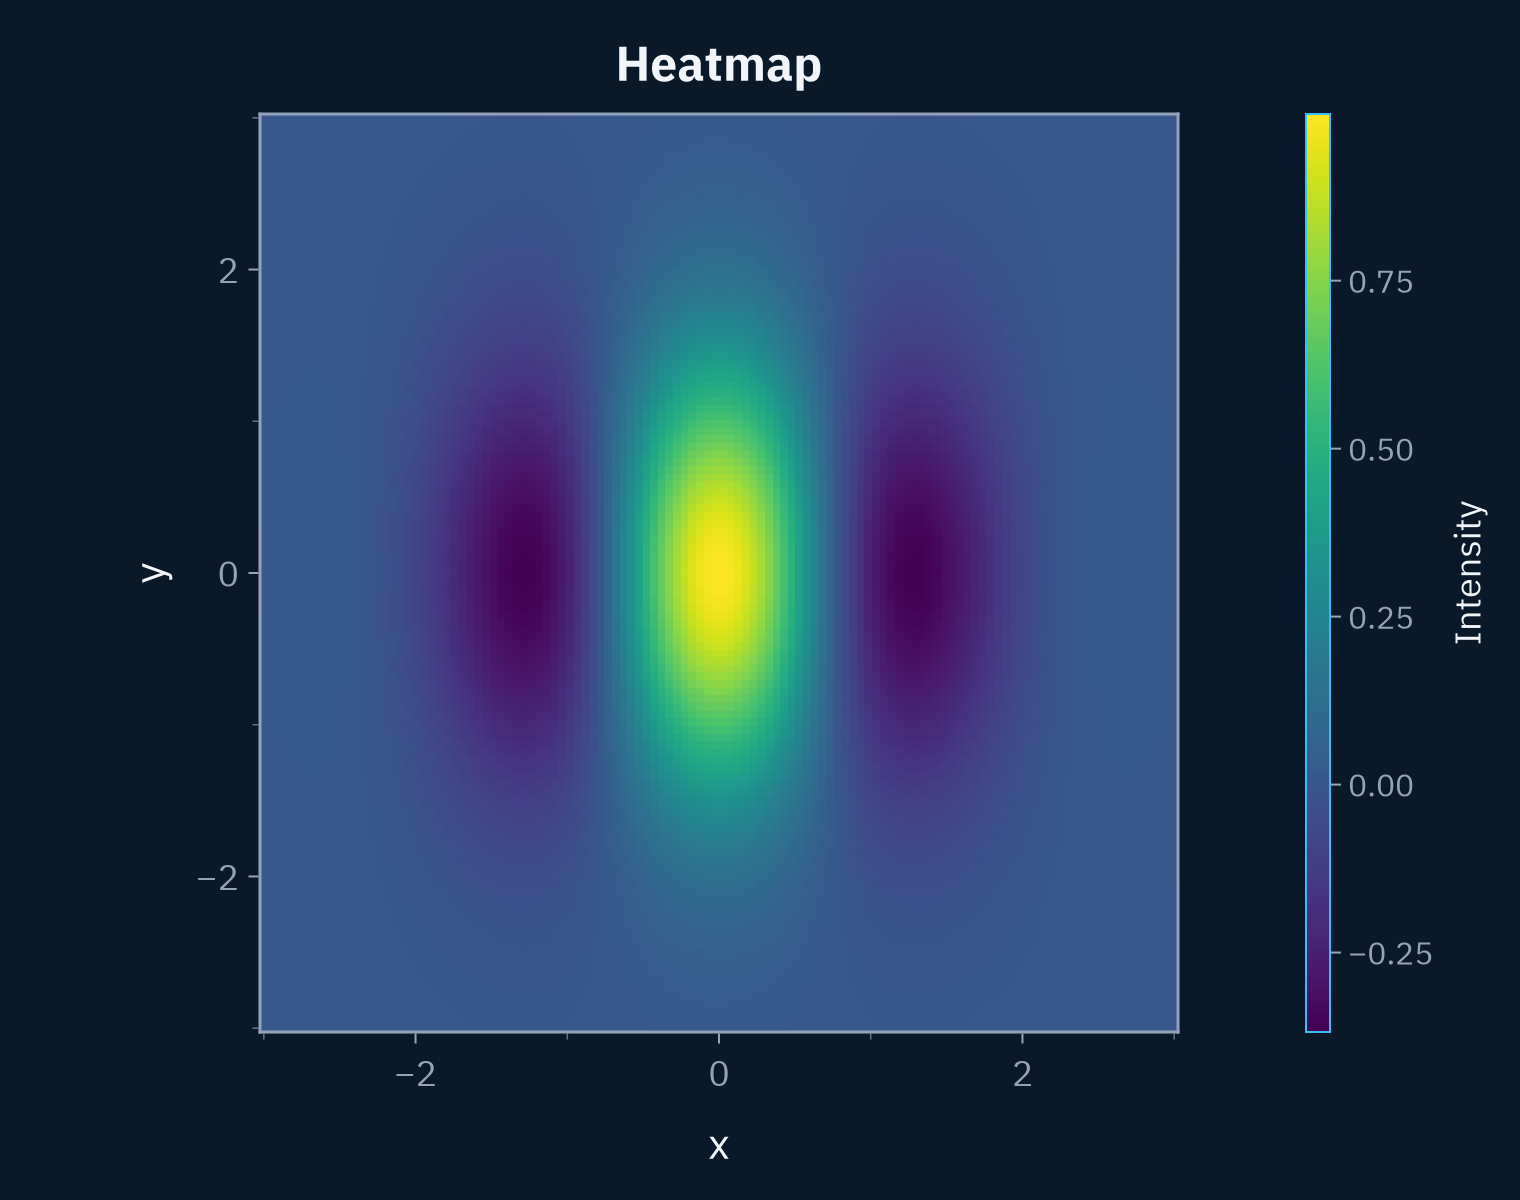
Options
Font Scale
The keyword fontscale uniformly scales every font size (tick labels, axis labels, titles, legends, etc.). It is useful when a figure is shrunk into a small slide area:
with_theme(SatelliteAnalysis.makie_theme(:dark; fontscale = 1.4)) do
    x, ys = line_data(; nseries = 2)

    fig = Figure(size = (900, 520))
    ax  = Axis(
        fig[1, 1];
        title  = "fontscale = 1.4",
        xlabel = "t [s]",
        ylabel = "Amplitude",
    )
    for (i, y) in enumerate(ys)
        lines!(ax, x, y; label = "series $i")
    end
    axislegend(ax; position = :rt)

    fig
end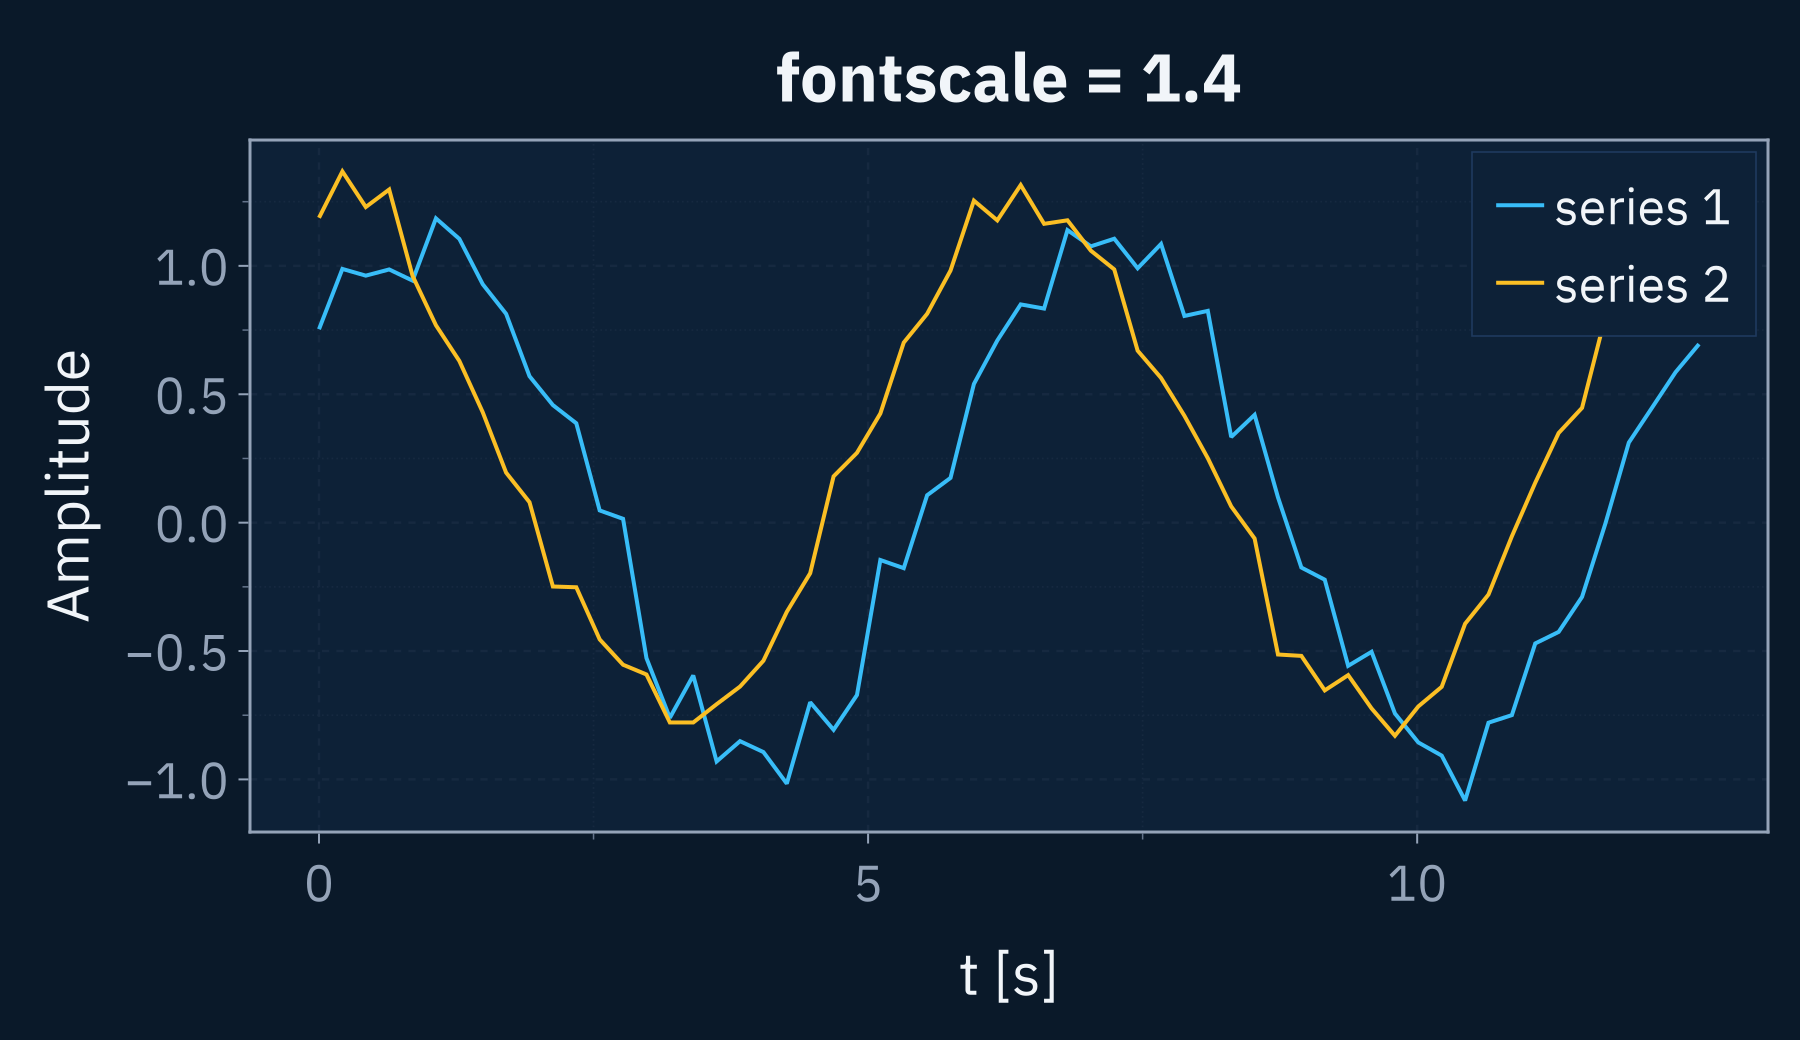
Monospaced Tick Labels
The keyword mono_ticklabels renders the axis and colorbar tick labels using IBM Plex Mono. The fixed-width digits keep numeric ticks vertically aligned, which is useful for plots dominated by numbers:
with_theme(SatelliteAnalysis.makie_theme(:dark; mono_ticklabels = true)) do
    years  = 2000:2:2026
    values = 1.0e6 .* (1.03) .^ (0:(length(years) - 1))

    fig = Figure(size = (900, 520))
    ax  = Axis(
        fig[1, 1];
        title  = "Monospace tick labels",
        xlabel = "Year",
        ylabel = "Value",
    )
    lines!(ax, years, values)
    scatter!(ax, years, values)

    fig
end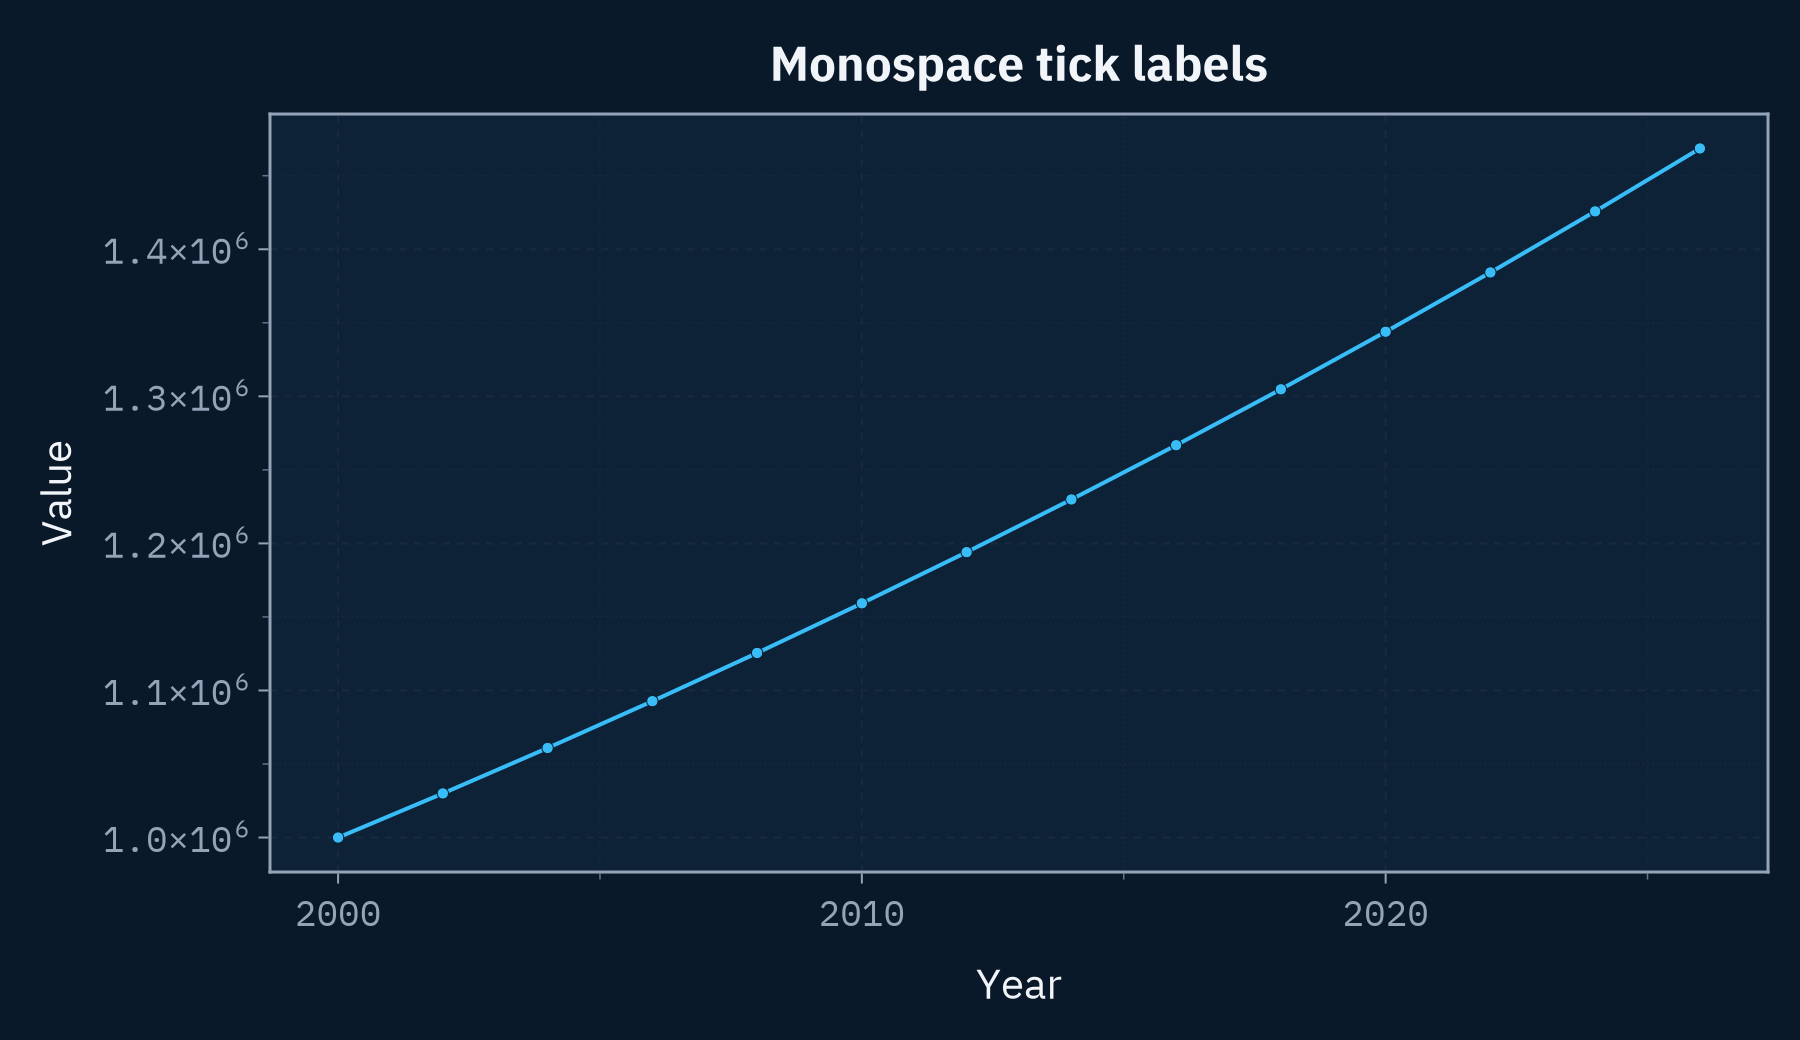
Palette
The function SatelliteAnalysis.makie_palette returns the first n colors of the 6-color categorical palette, matching the theme variant selected by the keyword variant:
with_theme(SatelliteAnalysis.makie_theme(:dark)) do
    dark  = SatelliteAnalysis.makie_palette(6; variant = :dark)
    light = SatelliteAnalysis.makie_palette(6)

    fig = Figure(size = (900, 300))
    ax  = Axis(fig[1, 1]; title = "Categorical palette")

    for (row, (name, pal)) in enumerate(("dark" => dark, "light" => light))
        y = 2 - row  # Dark on the top row, light on the bottom.
        for (i, c) in enumerate(pal)
            poly!(ax, Rect(i - 1, y, 0.92, 0.92); color = c)
        end
        text!(ax, -0.15, y + 0.46; text = name, align = (:right, :center))
    end

    limits!(ax, -1.4, 6.1, -0.2, 2.1)
    hidedecorations!(ax)
    hidespines!(ax)

    fig
end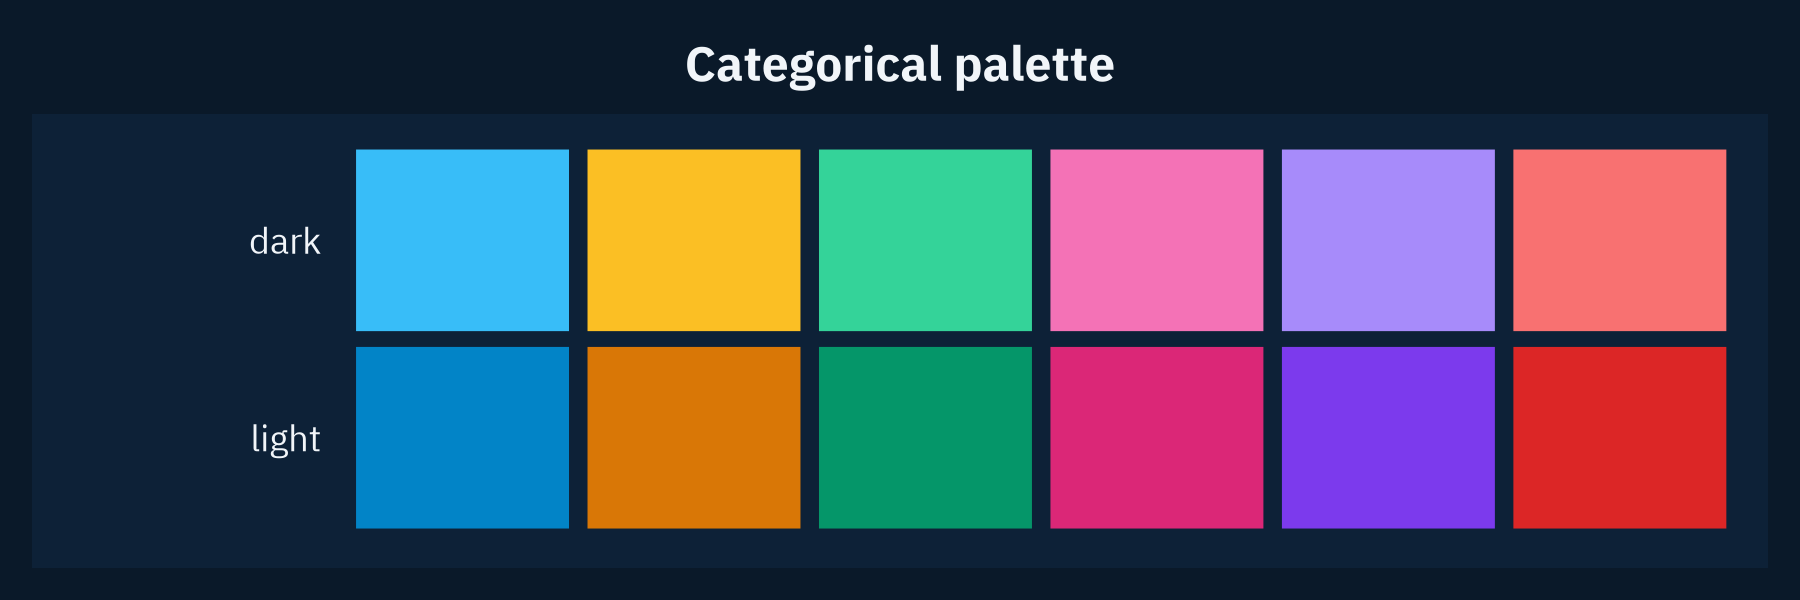
Fonts
The theme bundles the following fonts in assets/fonts/, so text renders identically regardless of which fonts are installed on the host system:
| File | Usage |
|---|---|
IBMPlexSans-Regular.ttf | Body text, tick labels, and axis labels. |
IBMPlexSans-Bold.ttf | Titles and legend titles. |
IBMPlexSans-Italic.ttf | Italic text. |
IBMPlexSans-BoldItalic.ttf | Bold italic text. |
IBMPlexMono-Regular.ttf | Tick labels when mono_ticklabels = true. |
IBM Plex Sans and IBM Plex Mono are copyright © IBM Corp. and are distributed under the SIL Open Font License 1.1. The license texts are available alongside the font files.